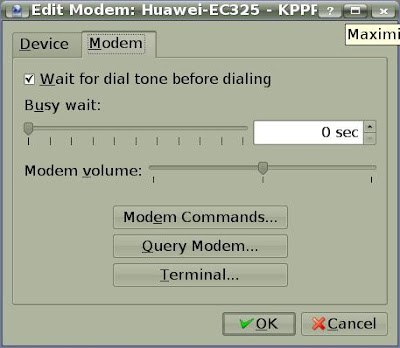
These steps are for Huawei EC325 CDMA modem on Kubuntu Hardy but the same steps could work to install any modem on any linux system (provided the generic driver matches)...
1) Hardware setup
Plug-in your reliance modem into any usb port and start up your computer (or reboot into Kubuntu if it was running when you plugged it in).
Ensure that you see the flashing light on the reliance modem which indicates that the modem at least the usb port you selected is not disabled and that it has range.
2) Identifying modem device
The default installation of Kubuntu Hardy already has the neccessary drivers for Reliance Netconnect EC325. All that needs to be done is to find out the device name that the OS uses to refer to the modem. Usually this is something like ttyUSB0.
A simple way to find out is to look in the OS bootup logs Use the following command at the command prompt which filters out to only the few lines mentioning modem / USB:
dmesg | grep modem | grep USB
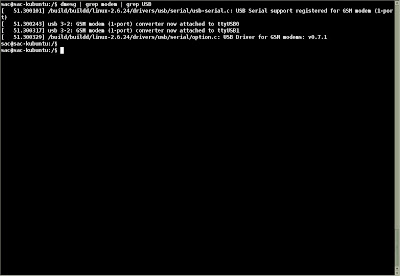
3) KPP Setup
To connect to the net, use the standard software, KPPP, to connect to the Internet. Start up this program from Internet->KPPP.
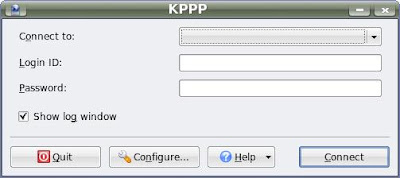
Click on configure to launch the KPPP Configuration window.
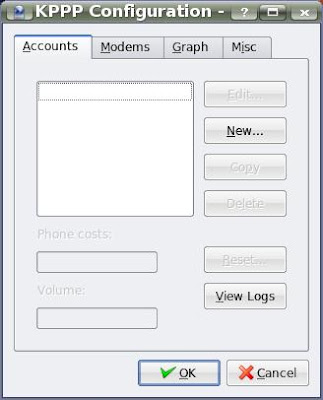
In the Accounts tab of the KPPP Configuration window, click on New... -> Manual Setup.
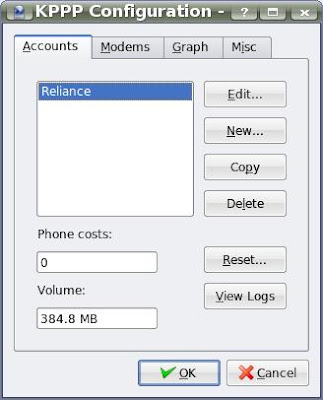
Give the connection a name, like Reliance.
Add the phone number to dial as #777 .
Leave everything else as default values and press Ok.
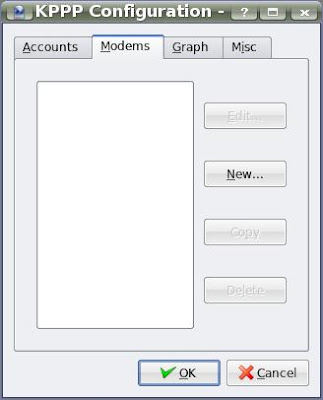
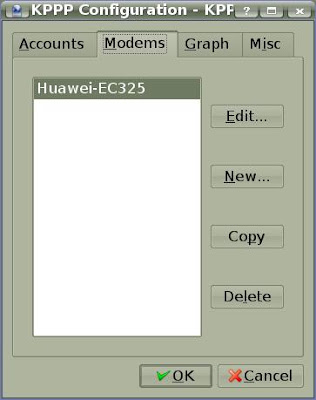
Now in the Modems tab of the KPPP Configuration window, click on New...
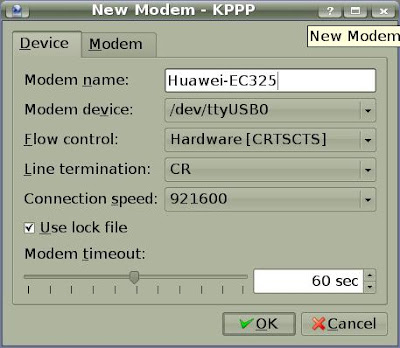
Give your modem a name like HuaweiEC325.
For Modem device, using the value identified in step2, look through the drop-down list and select the entry /dev/xxxx (eg: /dev/ttyUSB0).
Leave everything else as default values and press Ok.
Press Ok again to leave the KPPP Configuration window.
Finally, back in the KPPP main window, select the newly created Account from the Connect to drop-down list. Enter your netconnect mobile number in the Login ID and Password fields.
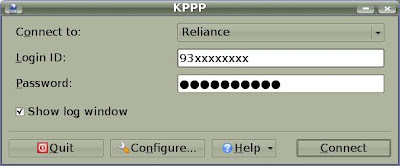
Click Connect!
Tuesday, December 16, 2008
Monday, December 1, 2008
Extending Glassbox
Glassbox provides method-level diagnosis but the details are limited:
in the Glassbox UI, only the summarized listing of operations is shown.
However using JMX, break-up of each operation into it’s monitored nested operations and resource access if any, are displayed with average, max time and count, using Glassbox’s built-in monitors for important frameworks (includes servlets/jsp, struts, ejb calls with method name, jdbc calls with details of each prepared statement & more). So Glassbox by default would log your EJB calls, your database calls, your JSP calls, etc.
In spite of this, other details (like parameters for a request, method name in actual class used, etc) for the response to each monitored operation are recorded only if it fails some SLA. In addition, this does not anyway capture names of low-level classes or their methods.
But what if you wanted a customized Glassbox monitoring - what if you were not satisfied with just a high-level EJB call and wanted to see the actual classes and methods called?
There are 2 ways to do this:
1) Using a simple run-time configuration in an xml file, and with NO CODING
2) Much more powerful customization if you were willing to define custom Aspects and pointcuts.
This post will stick to the simple way using the xml file.
But I do want to highlight before you proceed that adding more detailed logging means more bloating of PermGen memory-usage (see here on how to increase PermGen). For example, even in Glassbox's built-in jsp monitor’s load-weaving, 1 loader is needed per Jsp, and each loader takes up 1MB.
Also, read this post about Glassbox setup first - see Steps to configure Glassbox for Sun App Server .
Ok let's see how to provide a detailed method level monitorining for all the classes in a package you specify.
First, create a file aop.xml with the following content:
Next place this in a META-INF folder in any of the directories existing in your classpath.
That's it!
Next time you start up your server, Glassbox will monitor all the methods of all classes in the package, com.package.to.monitor!
in the Glassbox UI, only the summarized listing of operations is shown.
However using JMX, break-up of each operation into it’s monitored nested operations and resource access if any, are displayed with average, max time and count, using Glassbox’s built-in monitors for important frameworks (includes servlets/jsp, struts, ejb calls with method name, jdbc calls with details of each prepared statement & more). So Glassbox by default would log your EJB calls, your database calls, your JSP calls, etc.
In spite of this, other details (like parameters for a request, method name in actual class used, etc) for the response to each monitored operation are recorded only if it fails some SLA. In addition, this does not anyway capture names of low-level classes or their methods.
But what if you wanted a customized Glassbox monitoring - what if you were not satisfied with just a high-level EJB call and wanted to see the actual classes and methods called?
There are 2 ways to do this:
1) Using a simple run-time configuration in an xml file, and with NO CODING
2) Much more powerful customization if you were willing to define custom Aspects and pointcuts.
This post will stick to the simple way using the xml file.
But I do want to highlight before you proceed that adding more detailed logging means more bloating of PermGen memory-usage (see here on how to increase PermGen). For example, even in Glassbox's built-in jsp monitor’s load-weaving, 1 loader is needed per Jsp, and each loader takes up 1MB.
Also, read this post about Glassbox setup first - see Steps to configure Glassbox for Sun App Server .
Ok let's see how to provide a detailed method level monitorining for all the classes in a package you specify.
First, create a file aop.xml with the following content:
<aspectj>
<weaver>
<exclude within="org.springframework.jmx..*"/>
<!-- don't reweave -->
<exclude within="glassbox.inspector..*"/>
</weaver>
<aspects>
<concrete-aspect name="YourMonitor2"
extends="glassbox.monitor.ui.TemplateOperationMonitor">
<pointcut name="methodSignatureControllerExecTarget"
expression="within(com.package.to.monitor..*)"/>
</concrete-aspect>
</aspects>
</aspectj>
Next place this in a META-INF folder in any of the directories existing in your classpath.
That's it!
Next time you start up your server, Glassbox will monitor all the methods of all classes in the package, com.package.to.monitor!
Subscribe to:
Posts (Atom)