Tuesday, December 16, 2008

Connecting to the Internet with Reliance NetConnect USB Modem in Kubuntu Hardy 8.04

These steps are for Huawei EC325 CDMA modem on Kubuntu Hardy but the same steps could work to install any modem on any linux system (provided the generic driver matches)...

1) Hardware setup
Plug-in your reliance modem into any usb port and start up your computer (or reboot into Kubuntu if it was running when you plugged it in).
Ensure that you see the flashing light on the reliance modem which indicates that the modem at least the usb port you selected is not disabled and that it has range.


2) Identifying modem device
The default installation of Kubuntu Hardy already has the neccessary drivers for Reliance Netconnect EC325. All that needs to be done is to find out the device name that the OS uses to refer to the modem. Usually this is something like ttyUSB0.
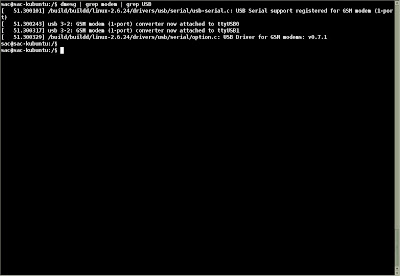
A simple way to find out is to look in the OS bootup logs Use the following command at the command prompt which filters out to only the few lines mentioning modem / USB:
dmesg | grep modem | grep USB


3) KPP Setup
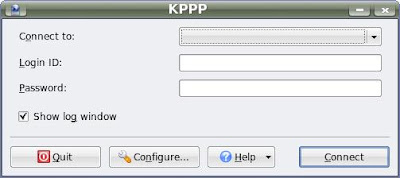
To connect to the net, use the standard software, KPPP, to connect to the Internet. Start up this program from Internet->KPPP.


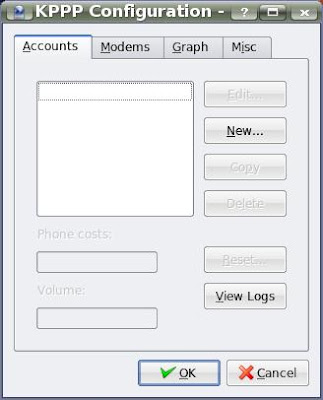
Click on configure to launch the KPPP Configuration window.


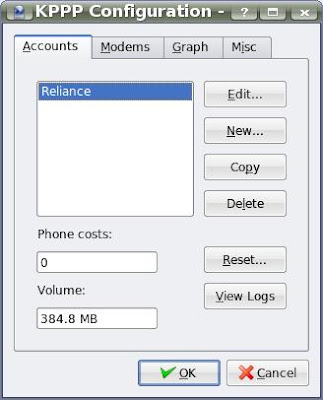
In the Accounts tab of the KPPP Configuration window, click on New... -> Manual Setup.
Give the connection a name, like Reliance.
Add the phone number to dial as #777 .


Leave everything else as default values and press Ok.


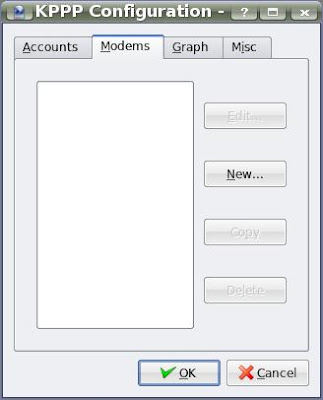
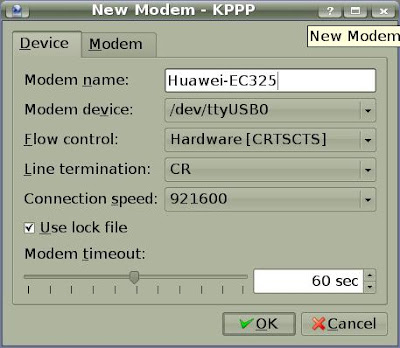
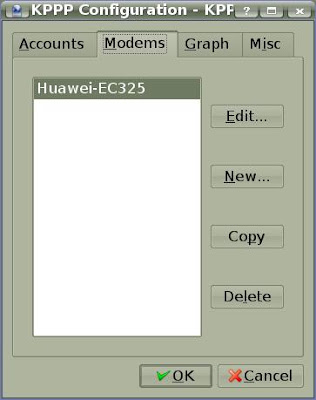
Now in the Modems tab of the KPPP Configuration window, click on New...


Give your modem a name like HuaweiEC325.
For Modem device, using the value identified in step2, look through the drop-down list and select the entry /dev/xxxx (eg: /dev/ttyUSB0).
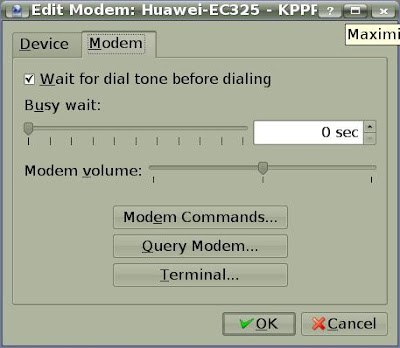
Leave everything else as default values and press Ok.


Press Ok again to leave the KPPP Configuration window.


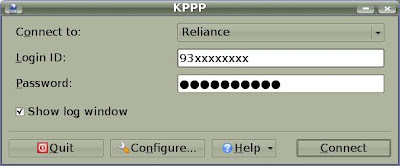
Finally, back in the KPPP main window, select the newly created Account from the Connect to drop-down list. Enter your netconnect mobile number in the Login ID and Password fields.


Click Connect!

Monday, December 1, 2008

Extending Glassbox

Glassbox provides method-level diagnosis but the details are limited:
in the Glassbox UI, only the summarized listing of operations is shown.

However using JMX, break-up of each operation into it’s monitored nested operations and resource access if any, are displayed with average, max time and count, using Glassbox’s built-in monitors for important frameworks (includes servlets/jsp, struts, ejb calls with method name, jdbc calls with details of each prepared statement & more). So Glassbox by default would log your EJB calls, your database calls, your JSP calls, etc.


In spite of this, other details (like parameters for a request, method name in actual class used, etc) for the response to each monitored operation are recorded only if it fails some SLA. In addition, this does not anyway capture names of low-level classes or their methods.


But what if you wanted a customized Glassbox monitoring - what if you were not satisfied with just a high-level EJB call and wanted to see the actual classes and methods called?

There are 2 ways to do this:
1) Using a simple run-time configuration in an xml file, and with NO CODING
2) Much more powerful customization if you were willing to define custom Aspects and pointcuts.

This post will stick to the simple way using the xml file.
But I do want to highlight before you proceed that adding more detailed logging means more bloating of PermGen memory-usage (see here on how to increase PermGen). For example, even in Glassbox's built-in jsp monitor’s load-weaving, 1 loader is needed per Jsp, and each loader takes up 1MB.
Also, read this post about Glassbox setup first - see Steps to configure Glassbox for Sun App Server .

Ok let's see how to provide a detailed method level monitorining for all the classes in a package you specify.

First, create a file aop.xml with the following content:

<aspectj>
<weaver>
<exclude within="org.springframework.jmx..*"/>
<!-- don't reweave -->
<exclude within="glassbox.inspector..*"/>
</weaver>
<aspects>
<concrete-aspect name="YourMonitor2"
extends="glassbox.monitor.ui.TemplateOperationMonitor">
<pointcut name="methodSignatureControllerExecTarget"
expression="within(com.package.to.monitor..*)"/>
</concrete-aspect>
</aspects>
</aspectj>


Next place this in a META-INF folder in any of the directories existing in your classpath.

That's it!
Next time you start up your server, Glassbox will monitor all the methods of all classes in the package, com.package.to.monitor!

Saturday, November 22, 2008

Connecting to Glassbox using JMX

The Glassbox UI is a wonderful way for anyone to quickly identify major bottlenecks. It quickly lists out most of the potential problems and even common solutions if any call exceeds the SLA.

But if you want to delve into even more details, you would need to use the excellent set of MBeans provided by Glassbox. If you have a default JMX configuration for your Glassbox installation, the following is the connection string:
service:jmx:rmi:///jndi/rmi://localhost:7232/GlassboxTroubleshooter

To connect using JConsole, provide this without username and password.

Navigate to Tree->Glassbox->stats in the left pane and click on your application for operations monitored by Glassbox - you may have to perform some activity on your application for the monitors to log anything of course.

Thursday, November 20, 2008

Additional Steps if encountering frequent “java.lang.OutOfMemoryError: PermGen space” exception.

Glassbox does take up some additional memory slowing the startup. Also, it tends to place additional load in the PermGen (Permanent Generation) memory space - this would result in the Server crashing out with "java.lang.OutOfMemoryError: PermGen space" exception (see http://blogs.sun.com/fkieviet/entry/classloader_leaks_the_dreaded_java for details).

The fix is a simple matter of increasing your max PermGen size (default is 64MB in Sun Servers). Use the following options when starting the JVM:
-XX:+CMSClassUnloadingEnabled
-XX:+CMSPermGenSweepingEnabled
-XX:MaxPermSize=128m

This actually works for any genuine PermGen error. But note that in most cases, PermGen running out of space is because of inefficient or incorrect cleaning up for Garbage collection - that is, some where in your code, you are unnecessarily keeping references even after use.

Thursday, November 13, 2008

Steps to configure Glassbox for Sun App Server

Prerequisites
Ensure that the steps are being carried out by the same user who created / installed the Sun App Server to avoid read / access issues.

Requirements:
Sun App Server 8.1
glassbox.war (latest file is available from Glassbox website)
Java 1.4 or above

Configuration steps:
1) Create a new base directory for Glassbox (eg: D:\Sun\glassbox). This should contain the configuration details & library files. I have gathered the neccessary files into glassbox_config.zip to make it simple - simply unzip the contents into this directory. See below on how to do this the hard way...
Additional key properties like elapsed time threshold, minimum slow threshold & thread-monitor interval can be specified in glassbox.properties in this directory.

2) Go to Sun One Admin Console and select Configuration->JVM Settings. Select the Profiler tab.


Name the profiler, Glassbox, and enable profiler adding the following details :
Classpath: D:\Sun\glassbox\lib\aspectjweaver.jar${path.separator}D:\Sun\glassbox\lib\glassboxMonitor.jar
JVM Option1: -Dglassbox.install.dir=D:\Sun\glassbox
JVM Option2: -javaagent:D:\Sun\glassbox\lib\aspectjweaver.jar
In the above settings, use whatever location chosen as base directory for Glassbox in step 1, if different from D:\Sun\glassbox.

By doing it this way, you can easily decide when you need Glassbox by coming here and turning on or off the Enable Profiler option.

3) Deploy glassbox.war on the server. Also modify server.policy to have the following additional entry:
// Following grant block is added for glassbox
grant codeBase "file:${com.sun.aas.instanceRoot}/applications/j2ee-modules/glassbox/-" {
permission java.lang.RuntimePermission "setContextClassLoader";
permission java.lang.RuntimePermission "getClassLoader";
permission java.lang.RuntimePermission "createClassLoader";
permission java.security.AllPermission;
};
The Glassbox Web Client would be available at <server-app-url>/glassbox after restart.

4) Restart the Sun App server. If the agent was installed successfully, the following should be present in the server.log:
“Glassbox Agent has started successfully.”


Obtaining Configuration files from latest glassbox.war
Extract all the files from glassbox.war located in the install/glassbox14 directory and copy the files to the target configuration directory.
Move the 2 copied jars into a lib sub-directory.

The final structure should be as below:
\--------
glassbox.properties
readme.txt
runtime.properties
\lib-----
aspectjweaver.jar
glassboxMonitor.jar


Additional steps for using Glassbox with JVM 1.4
If the Sun App Server uses a Sun / IBM 1.4 JVM, the createJavaAdapter has to be updated and added to the JVM start options –Xbootclasspath along with the unmodified file, java14Adapter.jar.

Extract aspectj14Adapter.jar and createJavaAdapter.jar from the glassbox.war located in install/glassbox14
Run java -jar createJavaAdapter.jar using the Java version you will use to run the server.
Copy the aspectj14Adapter.jar and updated createJavaAdapter.jar to the Glassfish base configuration directory.
Add the following additional JVM options in the Profiler section of Sun App Server:
-Xbootclasspath/p:\java14Adapter.jar
-Xbootclasspath/a:\createJavaAdapter.jar
Restart the Sun App server.


Additional steps for allowing Sun App Servers to give remote RMI access in Unix
If there are errors when accessing JMX on a different server than the one on which Glassbox is installed, ensure that the target remote server has the given permissions by adding the following in the server.policy file:
grant {
permission java.net.SocketPermission "*:1024-65535", "connect,accept";
};

Tuesday, October 28, 2008

Cross-site scripting and a simple solution

Most of us hardly give security vulnerabilities any consideration when creating a web-application. It's something that takes care of itself right? Mostly we get away with it because our applications may not be affected the moment it goes live. So it becomes a habit to ignore taking care of it.

But its a ticking time-bomb. Its strange because the cost associated with additional security considerations are negligible compared to the losses that can arise when the application is actually comprised!

One such vulnerability is XSS or Cross-site scripting. It comes out at number 1 for the second time running in the OWASP Top 10 2007 .

XSS accounts for 80% of today's Internet security vulnerabilities says one source.

First, let's learn about our adversary. XSS vulnerabilities can be categorized into three distinct types. Each of these can be exposed in a variety of ways - this is only limited by the imagination of the attacker.

  • DOM-based XSS vulnerability is when the problem exists in the page's client script itself. This shouldn't happen unless your web-application itself is hijacked by a malicious attacker who then adds script that attack "safe" standard local HTML pages (that are usually installed with most applications, including IE). What can be done about it falls more into the scope of a system administrator. The other 2 are our responsibility...

  • Non-Persistent or Reflected vulnerability is the most common type of XSS. This is seen easily when there are inputs by the client into a web-page and this is displayed on a page returned by the server. Basically, this would mean that only the user who makes the inputs are affected.

  • Then there's Persistent or Second-order or Stored XSS. This is when the impacted data is stored on the server (file/database/LDAP/etc) - it is the most dangerous kind as it can affect any user to whom the compromised data gets displayed to.
How does all that sound to those of us who copy/paste a few snippets to address XSS (add code to ensure that no < or > make it through our inout fields, etc.) - although the solution seems to be a matter of restricting user input (or our output), we are all not exactly security experts to know about the dangers (never mind that the experts themselves are having a tought time).

This is where we can use library/frameworks developed by those who know the range of attacks out there.

One such tool is Antisamy, an open-source free library from OWASP.
Antisamy can be used to verify that provided input (submitted by the user for example) does not contain any XSS vulnerability. It's highly configurable using XML files so that you can decide the amount of security you need for your inputs.
And the best part is that it generates user-friendly responses pointing out the vulnerability which can be shown to the user.

See below code showing how easy it is to use:
  /**
* @throws PolicyException
* @throws ScanException
* @throws IOException
*/
public static void testAntiSamy() throws PolicyException, ScanException, IOException {
// Create a sample input, inputString, that can have malicious code as well safe parts.
String inputString = null;
StringBuffer buf = new StringBuffer();
buf.append("This is all normal text.\n");
buf.append("But suddenly out of the blue...\n");
buf.append("An eveil laughter crackles in the cold night...\n");
buf.append("<SCRIPT>alert('HAHAHA');</SCRIPT>\n");
buf.append("Did you hear that??!!\n");
buf.append("No?\n");
buf.append("How about this twisted one: <SCRIPT>alert(\"HAHAHA\");</SCRIPT><SCRIPT>alert(\"HAHAHA\");</SCRIPT><SCRIPT>alert(\"HAHAHA\");</SCRIPT><SCRIPT>alert(\"HAHAHA\");</SCRIPT>\n");
buf.append("Or this eveil smile!!! <IMG SRC=\"javascript:alert('XSS');\" />\n");
buf.append("Its actually worse than the laugh right? Right?\n");
buf.append("\n");
buf.append("ok ok. Heres a normal smile <IMG SRC='javascript' />\n");
buf.append("Hows that!");
inputString = buf.toString(); // //readFile1("Antisamy/Other/SampleInput.htm");
System.out.println("Original input:");
System.out.println(inputString);

// Use the predefined Antisamy policy file and apply this on the inputString
Policy policy = Policy.getInstance("Antisamy/Sample_policies/antisamy-anythinggoes-1.2.xml");
AntiSamy as = new AntiSamy(policy);
CleanResults cr = as.scan(inputString);


// Display cleaned input using getCleanHTML() of CleanResults.
System.out.println("\nCorrected output:");
System.out.println(cr.getCleanHTML());

//Display the errors encountered in the input using getErrorMessages()
System.out.println("\nError Messages:");
System.out.println(cr.getErrorMessages().toString().replaceAll(".,",",.\n"));
}
Java Sourcecode to HTML automatically converted code (Java2Html Converter 5.0 [2006-03-04])
by Markus Gebhard markus@jave.de
Further information: http://www.java2html.de/

So it's just a matter of taking the input and validating it based on the rules specified in the xml file through the CleanResults class. There are so many useful methods in this class - get all the details by downloading javadocs (get the source too) alongwith the library (make sure you have not just the main Antisamy library but also the supporting libraries) and sample application configuration files from the Antisamy page.

Practically speaking though, Antisamy is best suited for you when you already have a server-side trip - so its easily used for type 3 XSS. For type 2, if you have a client-side only thing going on, then you have to consider the consequence of having a server round trip just for the validation...

Have a safer day at work (do share any inputs you may have).

Friday, October 24, 2008

Using JConsole to connect to an MBeanServer (JMX agent)

Here's some insights and tips on accessing the JMX Agent using JConsole.

JConsole is the most handy way to connect and test your JMX services since it comes with every JDK from Java 5 onwards. If you have your jdk/bin directory included in your path, it's just a matter of running it from a command prompt by typing:
jconsole

Its usage is pretty straightforward too. Once it's loaded, you can choose to connect from one of 3 options: Local, Remote and Advanced - there's one tab for each of these.

  1. Local - If you had registered your MBeans with the default JVM's MBean Server, select the Local tab. Here, the MBeans will be automatically displayed and all that needs to be done is to click on Connect.
  2. Remote - I find Advanced is actually simpler than this tab - so skipping this...
  3. Advanced - If you had registered your MBean from an application that you deployed on a J2EE server (like Sun One), then there are a few more steps as you have to use the Advanced tab.
    • Obtain your JMX connection URL either from the admin console or the server.log (it appears right after the server start-up entry - something like service:jmx:rmi:///jndi/rmi://localhost:8686/management/rmi-jmx-connector).
    • Type this into the JMX URL field.
    • Enter your server's username and password into those respective fields as well and click connect.

That's it! You're connected. You'll see a whole array of information - there's a chance you'd get overloaded! Head on over directly to the MBeans tab - here you can view all the MBeans successfully registered on this MBeanServer, in the Tree view on the left. Again, don't worry if you can't find yours at first - there might be lots of internal MBeans that the server registers that are crowding the list. Your MBean should appear in its fully qualified form, i.e. <<packagename>>.<<classname>>. Its pretty straightforward from here on - you can easily find your exposed methods / attributes and invoke / change them too.

Ok, seemed pretty easy but in real life, you would most probably run intos ome hiccups even before connecting. Most are obvious enough from the error messages. But what if you needed more details than one-line messags to troubleshoot? Unfortunately, the default Jconsole messages are not very helpful.

This is where you have to override the default values to get full stacktraces and much more.
This is a simple 2 step process:

  1. First download my sample log configuration file here.
  2. To enable detail messages, start jconsole with an extra argument:
    jconsole.exe -J-Djava.util.logging.config.file=<<properties>>
    where <<properties>> is the name of the downloaded log configuration file.
And you're done. You should get a detailed breakdown of the steps in between and full stacktrace of any errors in the command prompt window from which you launched JConsole.

Thursday, October 23, 2008

Using JMX

JMX is an integral part of J2EE but mostly neglected compared to other aspects. Here's some practical learnings.

Understanding
JMX is used to manage your application (or even the application server). It's a very simple 3-step process.
  1. You write your Management Beans or MBeans to provide the management functionality.
  2. Then your register your MBean with the MBean Agent (MBean Server).
  3. Now you can manage your application by connecting to the MBean Server and calling the required functionality.
When to use
The decision of when to forgo the use of configuration files and code to update settings and when to use JMX is not clear-cut. It's definitely a better idea when program management forms a larger part since JMX is very scalable. But I think JMX is an even better idea when you have limited managment requirements and don't want to add a custom user interface module just for the management. In this case, JMX allows you to provide the neccessary interface with just 10 lines of code and use of the ubiquitous JConsole to do the agent connection (see my Using JConsole to connect to an MBeanServer post on how to use JConsole for this).

Wednesday, October 22, 2008

Must have tools for the Smart Java Professional

Whether it's planning, design, development, reviewing, testing or tuning, there's a wealth of wonderful free (or nearly!) tools out there for the Java professional. It's not like all of them will be useful all the time... but its one of those things you should be knowing. No one wants to be in the situation of having a flat on a lonely highway and not knowing how to change the tire. It really helps to practice and familiarise with certain necessities even though you may not use them everyday.

Here's a list of my favourite tools (I'll stick to free / open-source) which I consider every Java professional should have in reaching distance. I will keep updating this post with useful Java tools - may add separate detailed posts for complex tools... would welcome any suggestions to update this list.

IDE
There are plenty of excellent Java Editors and this is what most beginners are encouraged to start with. But I think other than the geek-appeal, a more proficient Java professional should use a full-featured Integrated Development Environment (IDE) - don't give excuses like having to use one more program instead of your all-in-one editor is a pain, or that your IDEs hog your system (come on, you shouldn't be coding if your system is that slow!).
My favourite IDE is Eclipse - it's latest Ganymede release has different packages based on your usage - Java EE Developer, Java Developer, C/C++ Developer, etc, or just get Eclipse Classic.
Other IDEs (all with J2EE development features):
NetBeans - used to be very slow but I'm seeing a LOT OF good reviews about it now!
Oracle JDeveloper - supposed to be ok
IBM WebSphere Studio Site Developer - it's not limited to WebSphere Server btw
WebLogic Workshop - seems to tie you to the Weblogic Server, although that too comes along in the Free version
In general, the trend is love one and hate the rest! So choose wisely...

Security
This is a highly neglected area even though it is most fundamental part of any application especially as we go into the future. My one stop site for this is the Open Web Application Security Project website - Enterprise Security API (ESAPI) & Antisamy are available there. Also see my detailed post on Antisamy.

Code Review
Always ensure any code you touch, whether yours or not, gets time to go through a couple of code review tools. In the heat of reaching a target, developers just can't help taking shortcuts that result in code that can be caught in review tools and some of these mistakes can lead to major headaches at some point or the other.
Some of the common review tools include FindBugs, HammurAPI & CheckStyle. I got some nice feedback for JLint & PMD but I haven't tried them out. Both of these work purely on your source so they are really fast - whereas the other tools actually go through your generated class files and hence would catch logical or even runtime errors.
I should mention that no single review tool does a complete job - when it's upto me, I usually go for a combination of Checkstyle and FindBugs.

One more useful software is an Eclipse plugin called Metrics. This shows minute details of your code including a very good graphical representation of package dependency.

Code Testing
JUnit is the way to go for me but for J2EE applications, Cactus (which extends JUnit) is more suitable if you can stand the complexity. Also, there's Webtest to test interactions with your Web Application.

Code Coverage
EMMA comes to mind as the most comprehensive free tool for this. Emma ensure that there is no unused or poorly used code in use. It can also be used to verify that your Unit Test cases were complete.

User Interface Development
We already know all about the many Frameworks that ultimately give WYSIWYG plugins for our favourite IDE. Here's something different - Metawidget is a 'smart User Interface widget' that populates itself, at runtime, with UI components to match the properties of your business objects - it builds on your underlying framework and so is not competing with it.

Version Control
This doesn't really come in the category of a developer but just listing it to be complete - CVS and Subversion. See here for a good tutorial on how to use these.


HTTP Analyser
OpenScarab: Simple powerful small Java app that inspects all http traffic and shows full request response details - also allows you to tamper inject data... OpenSource, Java

Last Updated: 22-Oct-2010

Macro to fetch email addresses for a list of names from Exchange server

I came across an interesting problem the other day... one of my colleagues had left our firm in a hurry. But she wanted to send a farewell mail to all her colleagues - she'd got a list of names by copying the names in the "To" list from a mail opened in her office Outlook. However, these were only names (as they existed in our Exchange Server) and did not contain the actual email address.

I thought it was a simple thing to give her the email address list corresponding to those names right from my Outlook window... but after a frustrating 60 mins of trying all possible combinations, I had to accept defeat.

Instead, I made a little macro that does the job - just provide the list of names as on the exchange server, and it will fill the next column with the email addreses. Download the Excel sheet having macro here .. Check out the Readme worksheet for instructions.

Note: PREREQUISITE
You should have a signed-in session with Outlook connected to your Exchange server before running the macro.

For those who are curious about how it works, the code simply accesses the Global Address List of your exchange server through your signed in Outlook account, fetches the usernames (cn values from the exchange directory) and then manually appends the company domain (this is configurable) to it. Of course it won't work for those with multiple company domains... You can check out the code in the macro's section of the excel sheet (press Alt-F11 after opening the excel sheet).

For more robust handling like getting the correct whole smtp address (instead of appending the domain manually) is possible but it would entail using extended MAPI (lots n lots of code) or extra libraries CDO / Redemption with C++.

But VBA suits my purpose. And that's what good software is all about - meeting the need (not the wants)!
 
Superblog Directory